Marine Megafauna Interactions with Small-Scale Fisheries in the SW Indian Ocean: Review & Management Challenges
A comprehensive review of the status, research gaps, and management challenges concerning interactions between vulnerable marine megafauna and small-scale fisheries in the southwestern Indian Ocean.
Home »
Documentation »
Marine Megafauna Interactions with Small-Scale Fisheries in the SW Indian Ocean: Review & Management Challenges
1. Introduction & Background
This review addresses the critical interactions between small-scale fisheries (SSFs) and vulnerable marine megafauna—specifically marine mammals, sea turtles, and chondrichthyans (sharks, rays, skates)—in the southwestern Indian Ocean (SWIO). SSFs are vital for food security and livelihoods in coastal communities across developing regions. However, their operations often lead to significant bycatch and direct impacts on megafauna populations, which are characterized by K-selected life histories (slow growth, late maturity, low fecundity), making them exceptionally susceptible to population declines from even low levels of anthropogenic mortality.
The paper synthesizes existing knowledge, highlights severe data and monitoring deficiencies, and argues for urgent, collaborative, and evidence-based management strategies to ensure the sustainability of both fisheries and the marine ecosystems they depend on.
2. Review Scope & Methodology
The review encompasses peer-reviewed literature, grey literature (e.g., NGO reports, government documents), and expert knowledge from multiple SWIO nations, including Kenya, Tanzania (including Zanzibar), Mozambique, South Africa, and Madagascar. The methodology involved a systematic collation of data on:
Reported bycatch and direct catch of megafauna.
Fishing effort metrics and fleet characteristics.
Existing management measures and their documented effectiveness.
Socio-economic studies on fisher dependence on resources.
A key finding is the fragmented and often anecdotal nature of the data, preventing robust regional assessments.
3. Key Findings: Status of Interactions
Data Quality
Poor / Anecdotal
Landings & bycatch data are unreliable.
Species Vulnerability
Exceptionally High
Due to K-selected life histories.
Management Basis
Weak Evidence
Strategies often lack scientific foundation.
3.1. Data Deficiencies & Monitoring Gaps
Catch and landings data are universally described as poor in quality, resolution, and consistency. Compositional data is biased towards easily identifiable species, and cryptic mortality (e.g., animals that die after release) is largely unquantified. Understanding of fishing effort is limited, often relying on unsuitable proxies like number of boats, which fails to capture effective fishing power or spatial-temporal effort distribution.
3.2. Impacts on Vulnerable Species Groups
All three megafauna groups show signs of overexploitation and population decline in several SWIO areas.
Chondrichthyans: Face the highest threat due to targeted fishing for fins and meat, and high bycatch rates. Many species are Data Deficient on the IUCN Red List.
Marine Mammals: Cetaceans (dolphins, whales) and dugongs are caught as bycatch in gillnets and other gear.
Sea Turtles: All species are threatened, with bycatch in nets and targeted harvesting of eggs and adults being major issues.
3.3. Socio-Economic Context & Fisher Dependence
SSFs are not just an economic activity but a critical component of food security and cultural identity. Management interventions that fail to understand the degree of fishers' reliance on these resources—including the sale of bycatch for income—are likely to be ineffective or face strong resistance. Livelihood diversification is often limited.
4. Core Challenges for Research & Management
4.1. Evidence-Based Management Deficit
A central flaw is the formulation of management strategies without a strong evidence base. This leads to regulations that may be biologically inappropriate, socio-economically unsustainable, or unenforceable. The lack of baseline data and ongoing monitoring makes it impossible to assess the status of stocks or the impact of management measures.
4.2. Governance & Collaborative Frameworks
Governance is often top-down, with limited meaningful engagement of fishers and local communities. There is a lack of regionally collaborative frameworks to address transboundary stocks and shared challenges. The paper calls for a coalition of government agencies, NGOs, researchers, and fishers.
5. Proposed Solutions & Strategic Recommendations
The review concludes with a call for action centered on:
Improved Data Collection: Implementing standardized, science-based monitoring of catch, effort, and bycatch across the region, potentially using electronic monitoring and fisher self-reporting apps.
Co-Management & Stakeholder Engagement: Developing participatory management systems that integrate fishers' knowledge and secure their buy-in.
Building Regional Capacity: Strengthening local scientific and management institutions through training and resource allocation.
Developing Evidence-Based Policies: Using collected data to design spatially explicit measures like Time-Area Closures (TACs) or gear modifications that reduce bycatch while minimizing impact on fisher livelihoods.
Key Insights
The sustainability crisis is as much a data and governance crisis as it is a biological one.
Solutions must be co-designed with fishing communities to be legitimate and effective.
A regional approach is non-negotiable for managing migratory megafauna.
6. Critical Analysis & Expert Perspective
Core Insight: This review exposes a fundamental systemic failure in the SWIO: the management of a complex socio-ecological system is being attempted with pre-industrial data infrastructure and governance models. The paper correctly diagnoses the problem—a severe evidence deficit—but the proposed solution hinges on a level of regional cooperation and institutional capacity that currently does not exist at the required scale.
Logical Flow: The argument is logically sound: poor data → poor understanding → ineffective management → unsustainable outcomes. The paper effectively traces this causal chain, using the vulnerability of K-selected species as the biological amplifier of the problem.
Strengths & Flaws: Its major strength is its comprehensive, regional scope and its clear-eyed assessment of data poverty. A significant flaw, however, is its relatively light treatment of implementation pathways and political economy barriers. It advocates for "good governance" and collaboration but offers few concrete strategies for overcoming the entrenched interests, funding shortfalls, and political inertia that characterize fisheries management in many developing regions. Compared to technological leaps in other fields (e.g., the use of Generative Adversarial Networks (GANs) like CycleGAN for image-based species identification and monitoring as discussed in Zhu et al., 2017), the solutions proposed here feel incremental.
Actionable Insights: For practitioners and funders, the immediate priority should be investing in lean, technology-enabled data pipelines. Instead of waiting for perfect, government-led monitoring, support should go to pilot projects using:
1. Drones and satellite imagery (inspired by applications from organizations like Global Fishing Watch) to map effort independently.
2. AI-assisted image recognition on smartphones for fishers to log bycatch, reducing reliance on taxonomic expertise.
3. Blockchain or secure ledger systems for catch documentation to improve traceability and combat IUU fishing, a related issue. The goal must be to generate "good enough" data rapidly to inform crisis-level decisions, while building the longer-term institutional framework the paper envisions.
7. Technical Framework & Analytical Approach
To move from anecdotal to quantitative assessment, a standardized analytical framework is needed. A core component is modeling population vulnerability. This often uses a Potential Biological Removal (PBR) framework, adapted for bycatch. PBR estimates the maximum number of animals that can be removed from a population without causing decline:
Where:
$N_{min}$ = Minimum population estimate
$R_{max}$ = Maximum theoretical growth rate
$F_r$ = Recovery factor (typically 0.1-1.0)
However, in the SWIO context, $N_{min}$ is usually unknown. Therefore, a priority-setting framework based on relative risk is more practical. This can use a semi-quantitative Ecological Risk Assessment (ERA) approach:
Exposure is a function of spatial/temporal overlap and gear susceptibility. Consequence is a function of species' biological productivity (inversely related to K-selection) and current population status.
Analysis Framework Example Case
Scenario: Assessing bycatch risk for the dugong (Dugong dugon) in gillnet fisheries off northern Mozambique. Step 1 - Data Collation: Gather fragmented data: (a) Fisher interviews suggesting occasional captures. (b) Historical sighting maps from aerial surveys (WCS, 2010). (c) GIS layers of reported gillnet fishing zones. Step 2 - Exposure Index: Calculate spatial overlap between dugong habitat (seagrass beds) and gillnet effort. Use a simple scoring: 3 (High Overlap), 2 (Medium), 1 (Low), 0 (None). Assume score = 2. Step 3 - Consequence Index: Dugongs have very low $R_{max}$ (~5% per year). IUCN status is Vulnerable. Assign a high consequence score: 3. Step 4 - Risk Score: $\text{Risk Score} = 2 \times 3 = 6$ (on a scale of 0-9). This flags a High Priority for research and mitigation (e.g., testing acoustic pingers or modifying net profiles).
This framework allows managers to triage actions despite imperfect data.
Experimental Results & Chart Description
Conceptual Chart: Data Fidelity vs. Management Action Timeline
A hypothetical chart would show two curves. Curve A (Current Paradigm): Shows a long, flat period of "Data Collection" with low fidelity (high uncertainty), followed by a delayed and often ineffective "Management Action." Curve B (Proposed Agile Paradigm): Shows rapid iterations. It starts with "Rapid Risk Assessment" (moderate fidelity), leading to a "Pilot Mitigation Measure" (e.g., community-led time closure), which then generates "Local Compliance & Bycatch Data," feeding back to refine the assessment in a continuous loop. The key insight is that action cannot wait for perfect data; management must become a learning process.
8. Future Directions & Application Outlook
The future of sustainable SSF management in the SWIO lies in the convergence of participatory governance, appropriate technology, and adaptive science.
Hyper-Local, Tech-Enabled Co-Management: The rise of low-cost sensors, satellite AIS, and mobile apps will empower fishing communities to collect and own their data, forming the basis for genuine co-management agreements. Projects like SmartFish in the Pacific offer a model.
AI and Machine Learning: Beyond identification, AI can analyze patterns in catch and environmental data to predict bycatch hotspots, allowing for dynamic spatial management ("move-on" rules), similar to initiatives by the NOAA to protect sea turtles.
Alternative Livelihoods & Value Addition: Future interventions must proactively develop economic alternatives, such as community-based ecotourism focused on megafauna (whale sharks, dolphins) or value-added processing of sustainable fish catches, reducing pressure on vulnerable species.
Blended Finance and Impact Investment: Conservation outcomes need sustainable funding. Models that blend philanthropic grants with impact investment for community enterprises (e.g., sustainable aquaculture) will be crucial for long-term success.
Integration with Climate Adaptation: Management plans must be forward-looking, incorporating climate resilience. Protecting megafauna, which often play key roles in ecosystem function, can be a core strategy for maintaining productive fisheries in a changing ocean.
9. References
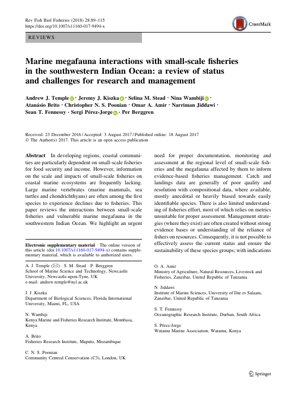
Temple, A. J., Kiszka, J. J., Stead, S. M., Wambiji, N., Brito, A., Poonian, C. N. S., Amir, O. A., Jiddawi, N., Fennessy, S. T., Pérez-Jorge, S., & Berggren, P. (2018). Marine megafauna interactions with small-scale fisheries in the southwestern Indian Ocean: a review of status and challenges for research and management. Reviews in Fish Biology and Fisheries, 28, 89–115.
Dulvy, N. K., et al. (2014). Extinction risk and conservation of the world's sharks and rays. eLife, 3, e00590.
Lewison, R. L., Crowder, L. B., Read, A. J., & Freeman, S. A. (2004). Understanding impacts of fisheries bycatch on marine megafauna. Trends in Ecology & Evolution, 19(11), 598-604.
Zhu, J. Y., Park, T., Isola, P., & Efros, A. A. (2017). Unpaired Image-to-Image Translation using Cycle-Consistent Adversarial Networks. Proceedings of the IEEE International Conference on Computer Vision (ICCV).
Global Fishing Watch. (2023). Transparency in Global Fisheries. Retrieved from https://globalfishingwatch.org
Heithaus, M. R., Frid, A., Wirsing, A. J., & Worm, B. (2008). Predicting ecological consequences of marine top predator declines. Trends in Ecology & Evolution, 23(4), 202-210.
IUCN. (2023). The IUCN Red List of Threatened Species. Version 2023-1. Retrieved from https://www.iucnredlist.org.